
Markets remained resilient through the third quarter of 2026 despite continued uncertainty across the economy and financial markets. Inflation concerns, geopolitical tensions surrounding Iran, tariff uncertainty, and questions surrounding a potential "AI bubble" remained prominent throughout the quarter. Yet despite these concerns, the S&P 500 reached 24-all time highs through the end of July, while major U.S. indexes remained above their 200-day moving averages.
Strong corporate earnings remained a primary driver of market performance, with earnings growth significantly exceeding expectations. At the same time, market leadership broadened beyond large cap technology, with small and mid cap companies and international markets delivering strong performance.
As the quarter progressed, investors were once again reminded that short term headlines and long term market outcomes can differ significantly. Although midterm election years have historically produced an average S&P 500 return of 4.7% and greater volatility, the S&P 500 was up approximately 9% through July, with only one significant drawdown of roughly 9% during the escalation of the Iran conflict earlier in the year.
Earnings, Not Multiples, Are Driving This Market
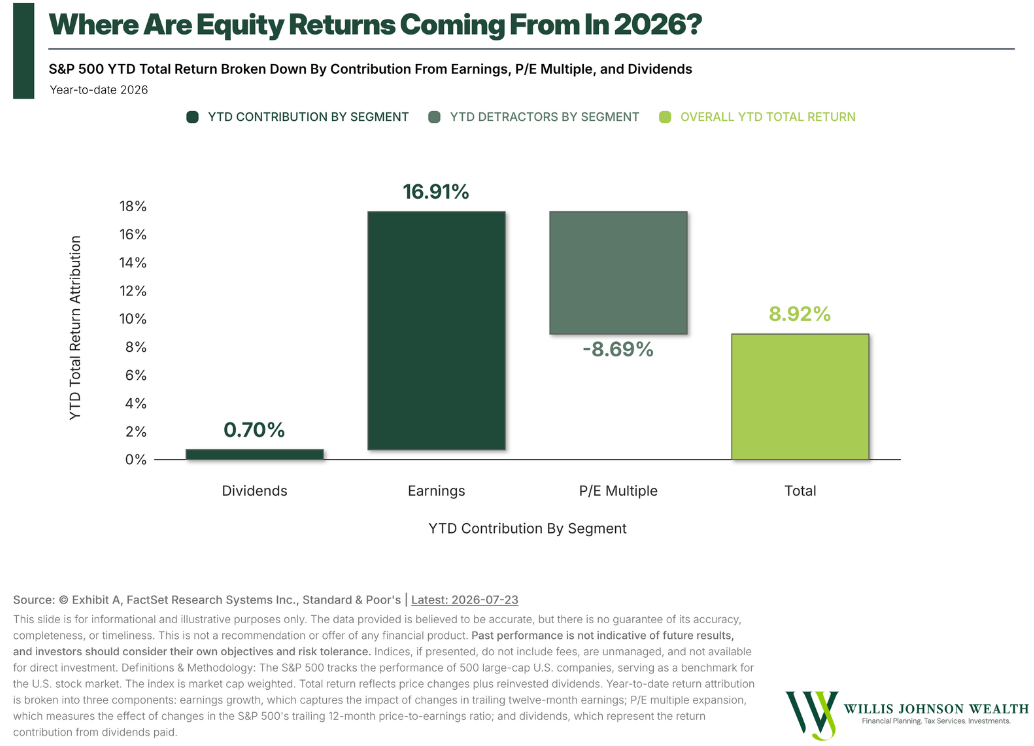
One of the more notable characteristics of the current market environment is that earnings growth, rather than expanding valuations, has been the primary driver of market performance. Earnings growth is running at approximately 17% year-to-date, exceeding expectations, while price-to-earnings multiples have declined by approximately 8.5%.
This dynamic differs from a market driven primarily by expanding valuations. Instead, earnings have continued to provide fundamental support for equity prices. Full-year consensus estimates currently call for roughly 28% earnings growth in 2026, with double-digit growth also projected for 2027 and 2028.
Corporate profit margins are also near their highest levels since the beginning of the century. While elevated margins have supported current earnings, they also raise questions about how economic growth is being distributed between corporations and labor. This dynamic is often described as a "K-shaped" economy and remains an important consideration when evaluating the broader economic environment.
 Source: FactSet, Standard & Poor’s, J.P. Morgan Asset Management. Hyperscalers is a market-weighted composite of AMZN, GOOGL/GOOG, META and MSFT. Semis = Semiconductors & Semiconductor Equipment Index. Hyperscaler 3Q25 and 1Q26 EPS numbers were adjusted to exclude non-cash impacts from tax and equity investments.
The AI Bubble
Hyperscalers, the companies leading AI infrastructure development, are investing at an unprecedented pace, with capital expenditures surpassing $416 billion in 2025 and projected to approach $1 trillion annually by 2028.
As AI spending accelerates, many hyperscalers have shifted from primarily funding these investments through free cash flow to issuing equity and debt, increasing borrowing costs and shareholder dilution. At the same time, earnings growth has begun to shift away from hyperscalers themselves and toward the semiconductor companies supplying AI infrastructure.
While these trends have prompted comparisons to the dot com bubble, current market data does not support that conclusion. Unlike the late 1990s, today’s hyperscalers are not trading at extreme valuations, and price to earnings multiples have continued to compress even as AI investment has accelerated. Projected future earnings and cash flows can still justify current valuations, suggesting that the current AI investment cycle is supported by underlying business fundamentals rather than purely speculative valuations.
 Source: Bloomberg, J.P. Morgan Asset Management. Data for 2026, 2027 and 2028 reflect consensus estimates. Capex shown is company total. *Hyperscalers are the large cloud computing companies that own and operate data centers with horizontally linked servers that, along with cooling and data storage capabilities, enable them to house and operate AI workloads. Guide to the Markets – U.S. Data are as of June 30, 2026.
Diversification Is Working
After several years of “why own anything but the Magnificent Seven,” market leadership has broadened considerably. The Magnificent Seven have been among the weaker performers over the trailing 12 months, while small-cap, mid-cap, and international equities have led.
International markets, in particular, are trading at attractive valuations relative to both the U.S. and their own long-term averages. This outperformance has occurred without relying on a weaker U.S. dollar. Regional index composition further highlights the benefits of diversification: the top 10 U.S. holdings are heavily concentrated in technology, while European and Japanese markets have greater exposure to financials and industrials, providing meaningfully different sector exposure.
Private markets, including private equity, private credit, and private infrastructure, can also provide additional diversification for investors with sufficiently long time horizons and adequate liquidity. Companies are remaining private longer than in the past, allowing more of the growth historically associated with small-cap companies to occur within private markets.
 Source: © Exhibit A, FactSet Research Systems Inc., Standard & Poor's | Latest: 2026-06-30
This slide is for informational and illustrative purposes only. The data provided is believed to be accurate, but there is no guarantee of its accuracy, completeness, or timeliness. This is not a recommendation or offer of any financial product. Past performance is not indicative of future results, and investors should consider their own objectives and risk tolerance. Indices, if presented, do not include fees, are unmanaged, and not available for direct investment. Definitions & Methodology: The returns shown represent year to date returns using the S&P 500 for U.S. large caps, the S&P 400 for mid caps, and the S&P 600 for small caps. For the remaining categories, returns are based on ETFs provided by iShares (EEM, EFA, TIP, AGG, DJP) and SPDR (GLD, BIL), with Bitcoin reflecting the change in its underlying price. Total returns are used when possible. Data is sorted by return from highest to lowest.
Inflation, Rates, and Fixed Income Positioning
Inflation has moderated, with headline CPI falling from 4.2% in May to 3.5% in June, but risks remain. Tariffs are still well above recent historical levels, while longer-term interest rates remain elevated. The 30-year Treasury yield recently reached 5.27%, increasing borrowing costs for consumers, businesses, and the federal government.
For fixed-income investors, higher starting yields have improved the outlook for bonds, but not all areas offer the same opportunity. High-yield credit spreads are currently just 2.84%, below their 3.89% historical average, meaning investors are receiving relatively little additional compensation for taking lower-quality credit risk. Municipal bonds may also offer attractive tax-equivalent yields for investors in higher tax brackets, supported by comparatively healthy state and local finances.
 Source: YCharts Past performance is not indicative of future results. This report has been generated through application of the analytical tools and data provided through ycharts.com and is intended solely for conducting investment research. The investment examples set forth in this presentation should not be considered a recommendation to buy or sell any specific securities. There can be no assurance that such investments will remain in the strategy or have ever been held in a WJW strategy. For discussion purposes only, not for external distribution. As of July 30, 2026.
The Consumer Backdrop Remains Resilient
Despite elevated interest rates and lingering inflation pressures, U.S. households remain relatively resilient. Household debt service payments are about 11.1% of disposable income, well below the 15.8% level reached before the Global Financial Crisis. The labor market also remains supportive, with unemployment at 4.2%, below its long term average of 5.61%, and job creation still positive.
Housing pressures have also moderated, with national home price growth slowing to just 0.84% year over year, while real wage growth has moved slightly back into positive territory. Although certain areas of consumer credit are showing increased delinquencies, the broader household backdrop remains on relatively solid footing.

Source: FactSet, FRB, J.P. Morgan Asset Management; (Top and bottom right) BEA. Data include households and nonprofit organizations. *Revolving includes credit cards. Values may not sum to 100% due to rounding. **Periods for which official data are unavailable are J.P. Morgan Asset Management estimates. Household debt service ratio data from 1Q80 to 4Q04 are J.P. Morgan Asset Management estimates. Due to the moratorium on delinquent student loan payments being reported to credit bureaus, missed federal student loan payments were not reported until 4Q24. Guide to the Markets – U.S. Data are as of June 30, 2026.
Long-Term Investing Requires Perspective
One of the clearest themes from 2026 has been the return of broader market participation. Leadership has expanded beyond U.S. mega cap stocks, while international equities, smaller companies, and fixed income have played a more meaningful role in diversified portfolios.
The economic backdrop also remains mixed. Inflation has moderated, household finances remain relatively resilient, and the labor market continues to provide support, while elevated interest rates, credit conditions, and longer term fiscal pressures remain important areas to monitor.
For long-term investors, the broader takeaway is to remain focused on diversification, fundamentals, and a portfolio strategy aligned with individual goals and risk tolerance rather than reacting to short term market narratives or recent performance. Past performance does not guarantee future results, and all investing involves risk.
For a second look at your portfolio or investment strategy, reach out to our team.